Detailed Runtime Analysis (Trace) of HTTP (OData) Requests
Context
We always had the requirement to measure OData Requests on a very detailed level. Transactions like /IWFND/TRACES were never detailed enough and barely provided useful feedback. That’s why we usually would write reports that execute certain logic and then trace it with SAT. This isn’t always sufficient as sometimes a request might be slower/faster depending on further implementation details in your OData service.
Solution
You can use a combination of transactions SICF and SAT for HTTP traces!
Simply follow these steps:
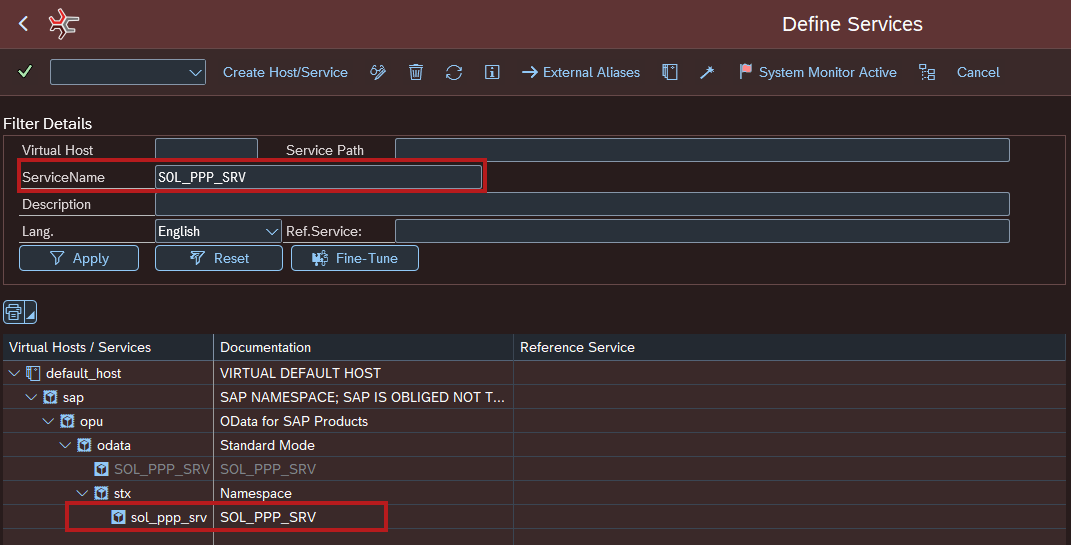
- Open Transaction SICF and find your service. You can use the ServiceName filter to find it quickly.
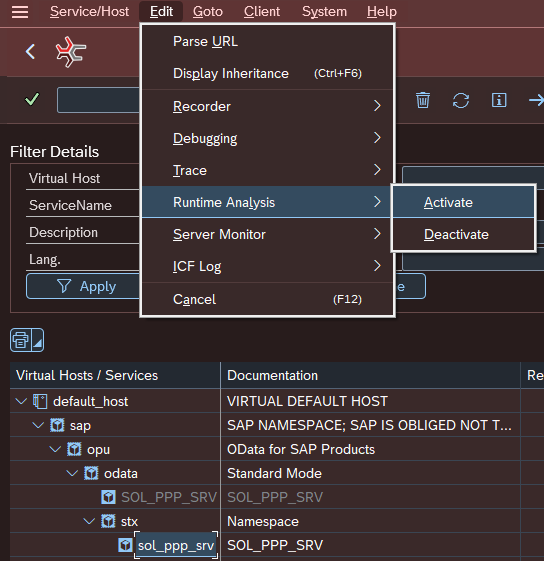
- Mark the entry and click Edit > Runtime Analysis > Activate
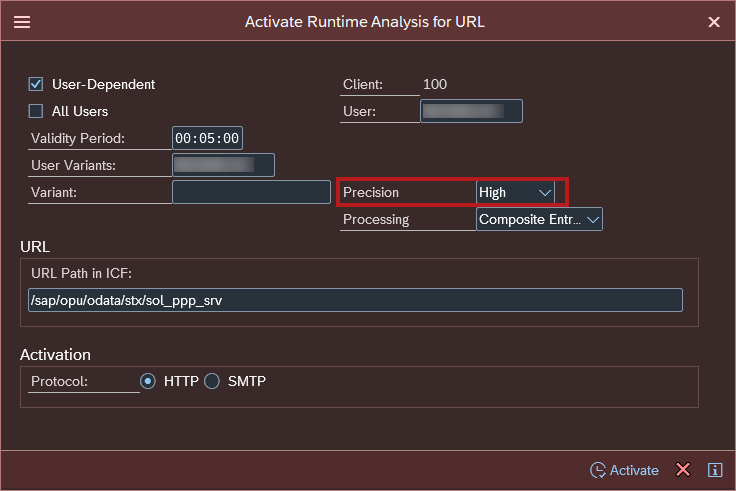
- Here you can define the validity period of the trace, user(s), precision. I usually leave everything on default and set the Precision to High. Afterwards click activate.
-
Now you have two options:
- Either go to your app and click through the UI, executing some kind of requests
- Or execute single requests via the Gatway Client
-
As an example I will execute a certain Gateway Client GET request.
-
After the execution, don’t forget to deactivate the trace again. Or set the validity to a short period.

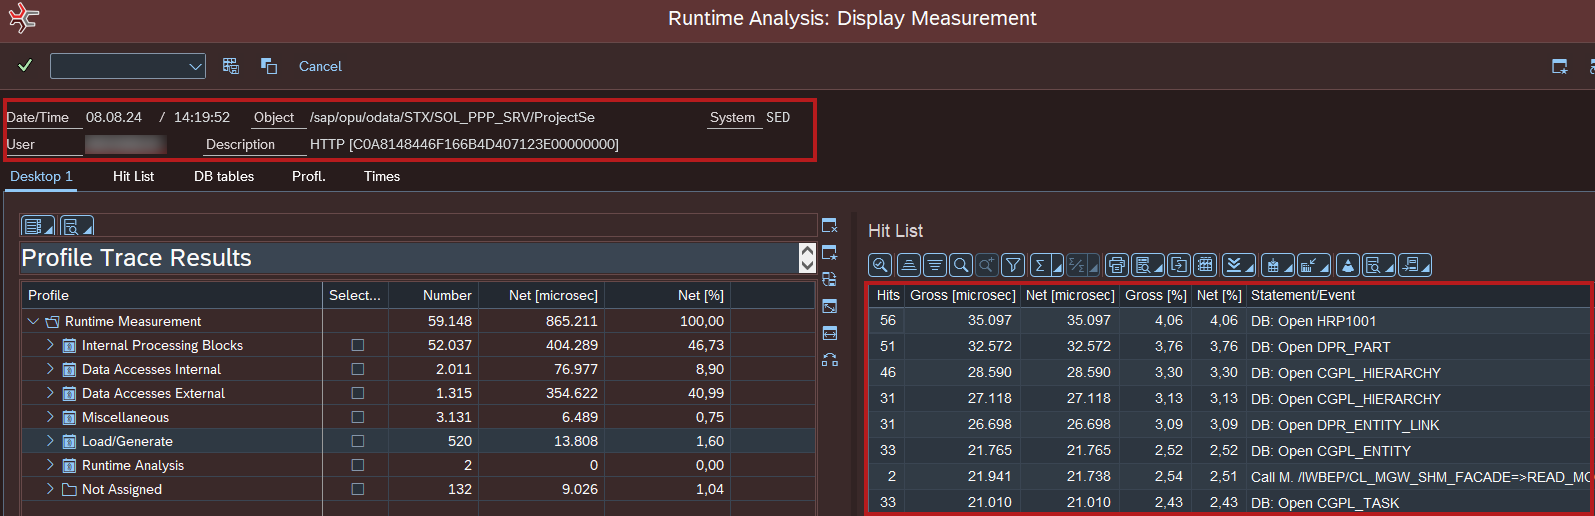
- Open Transaction SAT and go to the Evaluate tab. Here you can finally double click your request and find a detailed analysis in the regular SAT style.